
Prolonged culture of pluripotent and multipotent stem cells exposes the cells to strong selection pressures, often resulting in genomic alterations. Any genetic manipulation of the cells may further jeopardize their genomic stability. Genomic aberrations affect the differentiation capacity of stem cells, their stem cell identity and their tumorigenicity, and should thus be routinely evaluated for their proper use in basic research and in clinical trials. Here we review the common methods currently available to analyze the genomic integrity of stem cells, and present a recently developed method for the evaluation of the genomic integrity of stem cells by their gene expression profiles. We describe the principles of this method, provide guidelines for its implementation, and discuss its advantages and limitations compared to other available methods.
1. Introduction: Genomic instability in stem cells
Stem cells grown in culture are exposed to strong selection pressures that often results in genomic alterations, varying in size from point mutations, through copy number changes in small genomic elements (e.g. amplification of repetitive sequences and retroelement mobility), to large chromosomal aberrations, trisomies and monosomies (Lefort et al., 2009). While these aberrations are assumed to occur randomly, only those that confer a selective advantage would prevail and ultimately take over the culture. Different culturing conditions, such as media composition, cell passaging techniques, and freeze-thaw cycles, may affect the nature and the frequency of the acquired aberrations; however, no culturing technique is immune to genomic instability, and it is thus considered, for most practical purposes, a “necessary evil” that does not seriously compromise the utility of aberrant cells in basic science.
Stem cells acquire genomic changes throughout their expansion in culture. Much attention has been drawn in recent years to the genomic aberrations acquired by human embryonic stem cells (hESCs) and human induced pluripotent stem cells (hiPSCs), from the resolution of point mutations to the resolution of whole-chromosome trisomies (Baker et al., 2007; Ben-David et al., 2011; Gore et al., 2011; Hussein et al., 2011; Laurent et al., 2011; Mayshar et al., 2010). More recently, we have shown that human adult stem cells that are expanded in culture are also prone to acquire chromosomal aberrations (Ben-David et al., 2011). In both pluripotent and multipotent stem cells, the genomic aberrations are eventually acquired in a large portion of the cell lines, and the aberrant cells can take over the population within very few passages (Ben-David et al., 2011; Mayshar et al., 2010), making the genomic instability of human stem cells a prevalent phenomenon in need of proper evaluation and consideration.
The genomic alterations in human stem cells should not be disregarded as “force majeure” of unclear functional significance. These aberrations have been shown to interfere with the differentiation capacity of stem cells, thus jeopardizing basic research conducted with these cells (Biancotti et al., 2010; Enver et al., 2005; Werbowetski-Ogilvie et al., 2009). Moreover, with the arising of newer techniques for cellular reprogramming, comparisons between different types of stem cells (e.g. between ESCs and iPSCs or between iPSCs of various origins) have become widespread; when normal diploid cells are unintentionally compared to aberrant aneuploid cells, this may completely change the biological interpretation of such a comparison. Most importantly, the most prominent promise of stem cells is their potential to serve in cell-based therapy. Given that genomic aberrations are a characteristic of practically all cancer types, where they serve both as a driving force and as a by-product of tumorigenesis, these aberrations may increase the tumorigenicity of the cells, preventing their clinical implementations (Ben-David and Benvenisty, 2011; Ben-David et al., 2010; Goldring et al., 2011). The recent finding that each stem cell type is prone to acquire a characteristic set of genomic aberrations, which correlate the ones most frequently seen in tumors of the same cell-lineage (Ben-David et al., 2011), further increases this concern; and preliminary results that suggest that aberrant hESCs indeed generate more aggressive teratomas in an immunodeficient mouse model (Blum and Benvenisty, 2009; Werbowetski-Ogilvie et al., 2009), make this concern concrete.
The implications of genomic aberrations on stem cell research are far-reaching and encompass all of the potential applications of these cells (summarized in Figure 1). The potential use of aberrant stem cells in cell therapy is obviously hindered by increased tumorigenicity risk, by their limited differentiation capacity, and by possible functional deficiency in the differentiated cells. Their use for disease modeling is jeopardized due to artificial effects induced by the aneuploidy, and due to a possible failure to accurately recapitulate the disease-specific cells and phenotypes. Their use in drug screening studies is problematic, as the aberrant expression patterns and cellular properties may affect their sensitivity to drugs, leading to both false positive and false negative “hits”. Finally, their use in basic research of development and of stem cell properties may be negatively affected, since these cells do not mimic normal development. This applies the most to PSCs, which are commonly used to recapitulate early embryonic development, since chromosomal aberrations in viable cells are actually an artifact of culture propagation whereas in normal development they are almost always embryonic lethal.
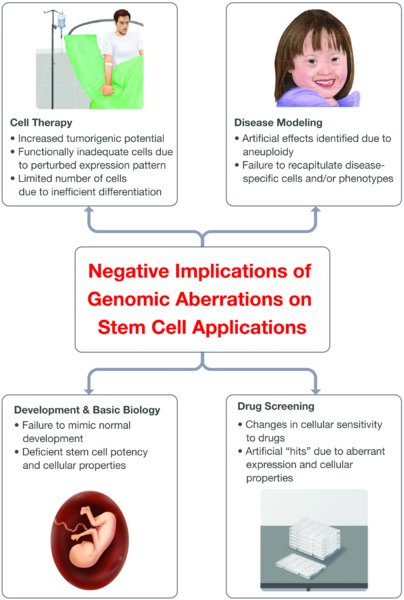
Genomic aberrations have potential detrimental consequences on all current applications of stem cells: cell therapy, disease modeling, drug screening, and the research of development and of stem cell biology. The applications appear in bold beside their schematic representation, and the most problematic implications of aneuploidy are mentioned below each one. All of the bullets apply to pluripotent stem cells, and most of them are also relevant to multipotent stem cells.
It is important to note that genomic instability is not a characteristic of human stem cells only, but is a common phenomenon in mouse stem cells as well (Ben-David and Benvenisty, 2012; Pasi et al., 2011; Quinlan et al., 2011), and it is likely to be found in stem cell cultures of all the species used in biomedical research. In the pluripotent field, mouse PSCs are the most studied system, and the genomic alterations in these cells may have broad consequences. In addition to their effect on the differentiation propensity and on the tumorigenicity of the cells, genomic instability in mouse PSCs may also influence the pluripotency of the cells, evaluated by their contribution to chimeras, germline transmission and tetraploid complementation (Liu et al., 1997). This further complicates the correct interpretation of studies conducted with aberrant mouse PSCs (Ben-David and Benvenisty, 2012).
In view of their high prevalence, rapid acquisition, tissue-specific identity, tumor-likeness, and the consequent functional significance, genomic alterations need to be rigorously and routinely evaluated in all types of stem cell cultures, and especially when comparing between cultures, when modeling diseases, or when striving to take them into the clinic. However, since most of the current available methods for evaluation of genomic integrity are technically-complicated, time-consuming, labor-demanding and/or costly, the analysis of genomic integrity has not yet become a common practice in most stem cell research arenas (with the exception of human PSCs, which are examined more often than other stem cell types).
2. Common methods for evaluation of genomic integrity
The current techniques to evaluate the genomic integrity of stem cells are mostly based on direct cytogenetic and DNA-based analyses. The most commonly used technique, by far, is the traditional karyotype analysis. Karyotyping is based on arresting the cells during cell division, followed by their staining, usually with Giemsa staining (G-banding). Based on the cytogenetic characteristics of the individual chromosomes at metaphase (e.g. size, centromeric location, unique pattern of light and dark bands), chromosomal abnormalities can be observed under the microscope. The average resolution of G-banding is about 10 Mb, depending on the region of interest (Meisner and Johnson, 2008; Speicher and Carter, 2005). The sensitivity of the method is quite high, since single cells are examined. Usually, 20 metaphases are observed, resulting in a detection threshold of >5% (that is, when over 5% of the cells in the population harbor a chromosomal aberration, it is likely to be detected). While it is relatively economical, karyotyping is still technically challenging and requires skilled personnel.
Spectral karyotyping (SKY) is a molecular cytogenetic technique that improves the resolution of the traditional karyotype (Schrock et al., 1996). Chromosome-specific DNA sequences are labeled with different fluorophores, generating unique fluorescent probes for each pair of chromosomes. The individually colored chromosomes are then visualized, and genomic changes can be detected. SKY is as sensitive as traditional karyotype, but is somewhat more expensive. Its resolution is higher than that of G-banding, and gets to about 2 Mb for the identification of translocations and complex karyotypes (Schrock et al., 1996). However, the resolution is much lower for the identification of intra-chromosomal duplications and deletions (Meisner and Johnson, 2008), especially when compared to that of the molecular methods described in the next paragraphs. In order to detect submicroscopic chromosomal aberrations beyond the detection threshold of SKY, complementary fluorescent in-vitro hybridization (FISH) may be applied. However, a suspected region of interest has to be determined in advance, in order to make this method useful.
Array-based molecular analyses of genomic integrity (also called “virtual karyotypes”) exhibit a dramatically-improved detection resolution, of ∼20 Kb to 1 Mb (depending on the probe density on the array (Speicher and Carter, 2005). The best known of these techniques are array-comparative genomic hybridization (aCGH) and single nucleotide polymorphism (SNP) array. In aCGH, the test sample and a normal reference sample are differentially labeled with different fluorophores, and are hybridized to thousands (or even millions) of probes. The ratio of fluorescence intensity is then measured, enabling to detect copy number changes along the genome. Similarly, SNP array is also based on labeling DNA fragments and hybridizing them on the array to allele-specific oligonucleotide probes. SNP array has a couple of advantages over aCGH: it can detect loss of heterozyogosity (LOH) events, and it can detect polyploidy (that is, the addition of an entire set of chromosomes, which cannot be detected in aCGH because test and control samples contain the same proportion of haploid sets per hybridized DNA) (Lefort et al., 2009). However, both techniques also have limitations when compared to cytogenetic methods: (a) they are more expensive; (b) their sensitivity is rather low – as they are based on DNA extracted from the cell population, genomic aberrations can be detected in a mosaic culture only if present at over 20% of the cells (Lefort et al., 2009; Meisner and Johnson, 2008); and (c) they cannot detect balanced translocations and inversions.
The integrity of stem cells can also be examined by whole genome sequencing, resulting in an extremely high single-base resolution, and the ability to detect a change as subtle as point mutation (Gore et al., 2011). However, the costs of this approach are considerably higher than the other techniques, and it is relatively much more demanding, which would probably prevent it from becoming a common practice in routine stem cell integrity analyses, at least for the next few years.
The cytogenetic and DNA-based methods for karyotyping are limited to the cell lines one works with at the lab, as they require either the cells of interest themselves, or DNA extracted from these cells. We have recently developed a methodology for detecting chromosomal aberrations in stem cells, based on the gene expression patterns of the cells. We have implemented this methodology for the accurate evaluation of the genomic integrity of human PSCs (both hESCs and iPSCs) (Mayshar et al., 2010), human multipotent stem cells (neural, mesenchymal and hematopoietic stem cells) (Ben-David et al., 2011), and mouse pluripotent stem cells (ESCs, iPSCs and epiblast stem cells) (Ben-David and Benvenisty, 2012). In the next section we will describe our methodology, and in the Discussion section we will discuss its strengths and limitations compared to the other methods. The comparison between the different methods to analyze the genomic integrity of stem cells is summarized in Figure 2.
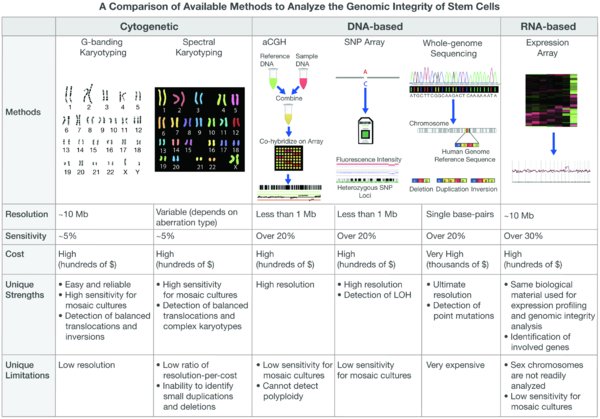
The common cytogenetic and molecular methods for evaluation of genomic integrity are schematically presented (top). The resolution, sensitivity, costs, strengths and limitations of each method are compared in the table (bottom).
3. Studying chromosomal aberrations in stem cells using gene expression profiles
3.1. The rationale
The methodology is based on the notion that if there's an extra copy of a chromosomal locus, there would be – on average – more expression from that specific region, and vice versa. Large clusters of genes with significantly higher or lower levels of gene expression could therefore indicate genomic gains or losses, respectively. The correlation between copy number and gene expression levels has been recognized recently in human tissues and cell lines, including in many cancers (Henrichsen et al., 2009; Hughes et al., 2000; Phillips et al., 2001; Pollack et al., 2002; Schoch et al., 2005; Tsafrir et al., 2006). However, the heterogenic nature of tumors and cancer cell lines has prevented an accurate detection of genomic alterations based on their gene expression solely.
In contrast to heterogenic tumor populations, all of the stem cell types that we have examined can be characterized by a unique and rather homogeneous gene expression profile (Ben-David et al., 2011; Mayshar et al., 2010). Furthermore, in cancerous cells some aberrations may be so common, that practically all cell cultures (or all primary tumors) of the respective cancer type exhibit them; in contrast, most stem cell lines are diploid, and no single aberration has been found to occur in the majority of the cell lines. Therefore, for each specific gene cluster, the median expression values would necessarily represent normal expression levels that result from two functioning copies of the respective genomic region, provided that the dataset of stem cells from which these median values are extracted is large enough.
3.2. The methodology
The methodology is based on two bioinformatic analyses. In the first one, the number of over-expressed genes is determined for each sample, and these genes are then subjected to a location enrichment analysis. In the second one, gene expression data is processed into a CGH-analysis program, which is “tricked”, as it is supplied with RNA expression profiles instead of DNA profiles. An algorithm is then applied to detect gene expression biases: if there's a gene expression bias along a large enough region, this would suggest a chromosomal gain or deletion in this particular locus. Naturally, in order to adequately implement these bioinformatic analyses, rigorous statistical tests are required, as well as validation of positive and negative results in order to estimate the resolution, sensitivity and accuracy (that is, the false positive and false negative rates) of the methodology. These might vary between different stem cell types and different microarray platforms (Ben-David et al., 2011; Mayshar et al., 2010). A schematic flow-chart of the analysis is presented in Figure 3.
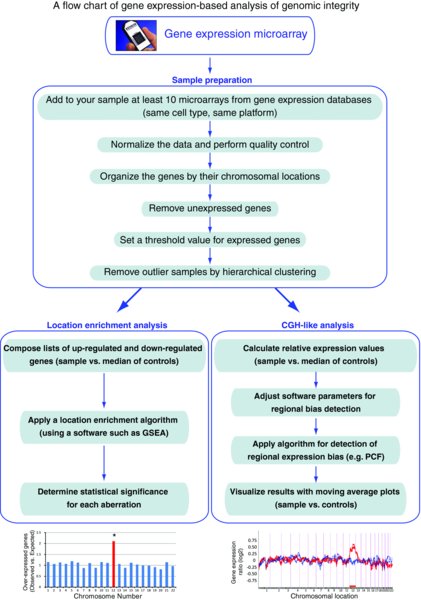
This chart presents the workflow of the methodology described in the text. The details of each step are elaborated in the section entitled “studying chromosomal aberrations in stem cells using gene expression profiles”.
3.3. Subjecting the sample of interest to DNA expression microarray
Naturally, the first step in the analysis is to derive RNA from the sample of interest and to perform a gene expression microarray. This microarray will then be used both for analyzing the expression profiles of the cells and for analyzing their genomic stability according to the biological question at hand.
3.4. Composing a database of gene expression profiles
A control database with gene expression profiles from the stem cell type of interest should be prepared in order to compare the expression patterns of the sample of interest to normal expression patterns of the relevant cell type. This step should be done only once for each microarray platform, and in future experiments the microarray results can be immediately compared to the existing database. Conveniently, gene expression microarrays are routinely deposited in open websites, such as Gene Expression Omnibus (GEO, https://www.ncbi.nlm.nih.gov/geo) and European Bioinformatics Institute databases (EMBL-EBI, https://www.ebi.ac.uk/microarray-as/ae), and can be downloaded from these websites. It is important to make sure that the downloaded microarrays were conducted using the same platform as was the microarray of interest (that is, the microarray from the cell culture to be examined for aneuploidy). Only samples of cells from the same tissue and developmental stage should be included in the analysis, in order to keep the level of background noise to minimum.
The raw data should then be normalized, using dedicated software. For example, Affymetrix microarrays are normalized using Expression Console (Affymetrix), according to the manufacturer's instructions. Besides normalization of expression values, this process also involves quality control and removal of problematic samples. In order to further decrease potential noise, gene expression analysis software, such as Partek Genomics Suite (Partek), may be used for hierarchical clustering, which enables the removal of outlier samples that cluster apart from the main group (i.e. cluster together with outgroup cell lines, rather than with samples of the same cell type); outliers may be the product of poor RNA quality, poor microarray or high levels of spontaneous differentiation, and should thus be detected and removed.
Next, genes that are not expressed in the stem cells of interest should be filtered out of the database, either by an Absent/Present call or by setting a threshold of minimal expression level. In order to prevent a bias towards genes that are over-represented in the specific platform used, multiple probesets for the same gene are removed, so that each expressed gene is ultimately represented by one probeset only. In order to reduce bias due to low expression levels, it is also recommended to raise values under a certain threshold to a “floor” threshold. Expressed genes with very high variation in their expression values among normal samples, may also be excluded from further analysis.
Lastly, for each gene in the composed list, the median expression of all samples is calculated. In order to reduce possible bias from any given experiment, large groups of similar samples with highly similar gene expression profiles (as judged by hierarchical clustering) should be averaged for the sake of calculating a reliable population median. These median values are the expression values to which the sample/s of interest will be compared.
3.5. Location enrichment analysis
The first bioinformatic analysis is based on a chi-square-like statistical test. The idea that underlies this test is that a gain of genetic material should result in over-expression of genes inside this region, so that this genomic region will be over-represented when the chromosomal locations of all over-expressed genes are dissected. Similarly, a loss of genetic material should result in over-representation of this region when the chromosomal locations of all under-expressed genes are examined.
The analysis begins with composing separate lists of up-regulated and down-regulated genes for each analyzed sample. Up-regulated genes are determined as genes that are expressed over ∼1.5-fold than the median expression of that gene. Down-regulated genes are genes expressed less than ∼0.5-fold than the median expression.
The lists of over-expressed and under-expressed genes are then analyzed using gene expression analysis software, such as EASE ( https://david.abcc.ncifcrf.gov/ease/ease1.htm) or Expander ( http://acgt.cs.tau.ac.il/expander). Such programs employ a built-in location enrichment algorithm that performs statistical tests to discover over-represented genomic regions in its input list of genes. Multiple-testing correction should naturally be performed to determine the real statistical significance of the results.
3.6. CGH-PCF analysis
The second bioinformatic analysis makes use of the same microarray data, but employs a completely different statistical test, and is thus complementary rather than redundant. Instead of counting the over- or under-expressed genes, this analysis examines the average ratio between gene clusters expression levels and their median expression levels, and identifies spatial patterns throughout the genome.
The first step in this analysis is to divide each gene expression value, in each sample, by its median expression across all samples. The file of relative values is then imported to a CGH analysis program, such as CGH-explorer ( http://heim.ifi.uio.no/bioinf/Projects/CGHExplorer/). Once the data is uploaded to the software, the program's piecewise constant fit (PCF) algorithm is applied, in order to detect gene expression regional biases. A few parameters need to be determined at this point, the most important of which are the “least allowed deviation” and “least allowed aberration size”. Different parameters may be required for different stem cell types, different species and/or different chromosomes, and the specific parameters for each case should be adjusted using samples with known genomic aberrations (see section “Resolution and accuracy”). The results may be visually presented by drawing moving-average plots; however, the call whether a regional bias indeed represents a genomic aberration is made by the PCF-algorithm, and is thus unprejudiced.
3.7. Resolution and accuracy
If working with stem cell types or microarray platforms that have not been previously evaluated, it is important to carefully evaluate the resolution and accuracy of the methodology, as there's often a trade-off between the two. The resolution of the location enrichment analysis depends on the resolution of the selected software used, and is often limited to the resolution of a chromosomal band. The resolution of the CGH-PCF analysis is higher, and it depends on the selected parameters. We previously reported the identification of validated 11.7 Mb gain and 8.8 Mb loss in pluripotent stem cells, suggesting the validated resolution of the analysis to be ∼10 Mb (Mayshar et al., 2010).
The parameters of the CGH-PCF algorithm may have considerable influence on the accuracy of the results, and should therefore be adjusted for each stem cell type and microarray platform, using known aberrations. Preferably, cell lines that have been cytogenetically analyzed and/or subjected to molecular karyotyping (CGH or SNP arrays) at the same passage of RNA extraction, should be used for parameter tuning. Confirmed diploid cells analyzed in this manner can determine the false positive rate of the selected parameters, whereas confirmed aberrations can serve for determining the false negative rate. At the abovementioned resolution of ∼10Mb, we could reach a false positive rate as low as 0.005, with practically no false negatives, when analyzing human pluripotent stem cells (Mayshar et al., 2010).
For the sake of further increasing the reliability of the method, only aberrations that meet the stringent criteria for statistical significance in both of the bioinformatic analyses should be considered true aberrations. Those identified by only one of the analyses should be confirmed by one of the traditional methods in order to confidently assess the status of their genomic integrity.
4. Discussion
Gene expression profiling is commonly used to characterize stem cells. The arsenal of available methods for analyzing the genomic integrity of stem cells has been recently enriched by an indirect, yet accurate and specific, gene expression-based method. This method has several salient advantages over the cytogenetic and DNA-based methods (see Figure 2). Importantly, it enables the retrospective analysis of multiple cell lines that would otherwise not be accessible to any single study. As gene expression arrays are routinely deposited in the GEO database, very large datasets are available for such analyses, resulting in comprehensive studies that cover the majority of existing stem cell lines (Ben-David et al., 2011; Ben-David and Benvenisty, 2012; Mayshar et al., 2010).
Another obvious advantage of this method is that once a recurrently aberrant region has been identified, the genes that reside inside this region can be readily analyzed. The functional implications of genomic abnormalities thus identified become immediately apparent with the identification of the genes whose expression is actually perturbed. For example, we have reported that the hallmark pluripotency genes NANOG and GDF3 reside inside the minimal amplification in chromosome 12p that characterizes hESCs and hiPSCs. Using expression data, we could demonstrate that these genes are indeed consistently up-regulated as the aberration spreads in culture (Mayshar et al., 2010).
Moreover, using the same biological material both for gene expression profiling and for assessing the genomic integrity is advantageous, economically and biologically. From the economic point of view, it saves the time, effort and money that would otherwise be invested in a dedicated examination of genomic integrity (using one of the other methods); from the biological point of view, it prevents mistakes and misinterpretation of results obtained from aberrant cell cultures. Since genomic alterations can be acquired in stem cells very rapidly, within few passages, and since the gene expression profiling is often conducted several passages after the karyotype evaluation, expression analyses have been unintentionally conducted with aberrant cells, as we have shown in human PSCs (Mayshar et al., 2010), human adult stem cells (Ben-David et al., 2011) and mouse PSCs (Ben-David and Benvenisty, 2012). Naturally, this gap between the time of expression profiling and of karyotype analysis is completely abolished when expression profiling itself is used for virtual karyotyping.
However, the gene expression-based method also has disadvantages and limitations (see Figure 2). The first of which is that only cell lines whose gene expression profile has been analyzed similarly, can be compared to each other. This means that only once a microarray platform has been used for a sufficient number of samples, the generation of a normal expression baseline would become feasible, making it useful for the purpose of genomic integrity evaluation. Moreover, the parameters should be adjusted and validated for each platform and each stem cell type separately, adding a further technical complexity to the analysis.
As for the resolution of the method, while it is about the same as that of traditional karyotyping, it is not as high as that of CGH or SNP arrays. Furthermore, the resolution is limited by the number of expressed genes in the examined cell type. The unbalanced distribution of genes along the genome dictates that euchromatic regions with higher gene abundance will be detected at higher resolution than heterochromatic regions. The sensitivity of the method is also lower than that of CGH arrays, SNP arrays or karyotype analysis in identifying abnormalities that exist only in a subpopulation of the culture. For an abnormality to be manifested in the gene expression data strongly enough to allow its detection, we estimate that it needs to be harbored by at least one third to one half of the cells in the examined culture.
Another potential limitation of the method is that epigenetic regional modifications may affect the interpretation of the data. This is not a serious limitation in the analysis of the autosomal genome: clusters of genes that are known to be co-regulated do not come up as false aberrations; and identified aberrations do not harbor genes known to be co-regulated or to share functional annotations. However, this limitation prevents the analysis of chromosome X, due to the variation in chromosome X-inactivation, which is very common in PSCs and may be wrongly interpreted as aberrations (Bruck and Benvenisty, 2011; Mayshar et al., 2010). Chromosome Y cannot be readily subjected to the analysis as well, due to the paucity of genes in this chromosome, therefore the method is currently limited to the analysis of the genomic integrity of the autosomal genome.
In conclusion, the new methodology for the analysis of the genomic integrity of stem cells is a complementary method, which – like any other method – has its strengths and pitfalls in comparison to other available technologies. Considering the genomic instability of stem cells during their propagation in culture, we hope that this method will promote and facilitate the routine and thorough analysis of the genomic integrity of stem cells.
Acknowledgements
N.B. is supported by The Legacy Heritage Biomedical Science Partnership Program of the Israel Science Foundation (grant No. 943/09) and by the Centers of Excellence Legacy Heritage Biomedical Science Partnership (grant No. 1801/10).
